In this article, we will go through how we can set a basic environment to retrieve information from a target system and review its log on the Sentinel Azure platform.
Summary
Create Your Azure Free Account Windows 10 VM creation and Sysmon deployment Sentinel Creation Sysmon Installation on Windows Retrieve logs Conclusion
In this post, I’ll provide an example use case and then dive into the tool’s features and the changes I’ve made.
Create Your Azure Free Account
Welcome to this introductory guide on setting up an Azure account, specifically tailored for using Azure Sentinel in a Security Operations Center (SOC) lab. Azure Sentinel is a cloud-based Security Information and Event Management (SIEM) solution that helps in detecting, investigating, and responding to threats efficiently.
Be sure to follow the video step-by-step for a more effective learning experience.

Windows 10 VM creation and Sysmon deployment
Creation of Win 10 on Azure The first thing to do is to create a virtual machine on Azure, we go to “All resources” and look for “Microsoft Windows 10”

We create our machine, keep everything simple and to standard, and don’t add another functionality that may cost you extra fees, with this VM we will go with the cost of 4GB of RAM:
After creating the machine and setting the user and password we allow only our IP to connect to the machine via RDP
Once the security rule is updated, we connect to the machine via RDP
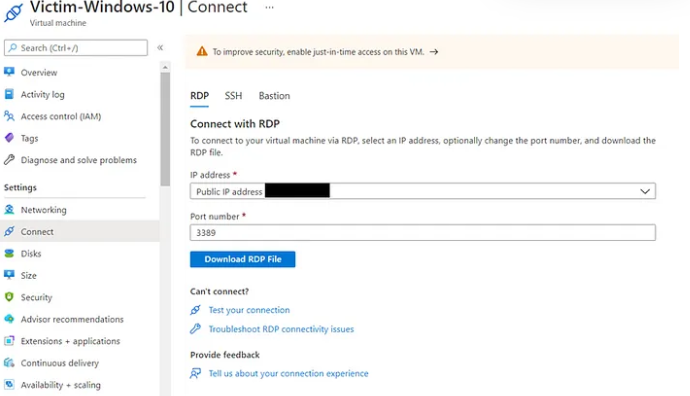
We connect now via RDP or we can simply download the RDP file.
Enter the password and click on ‘Yes’ to proceed:
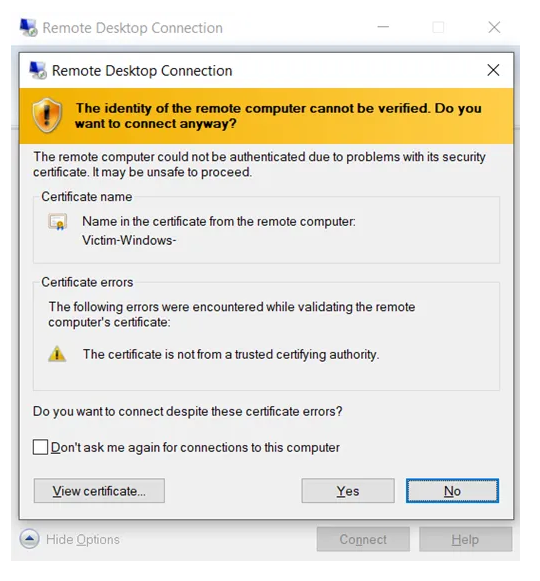
Now we are connected.
Sentinel Creation
We need to create our workspace, so we search for Microsoft Sentinel in the search bar:
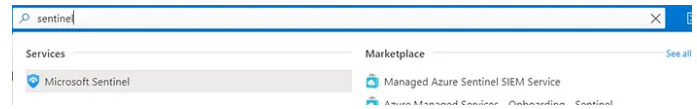
Once we are redirected to Sentinel, we create a new workspace:
We created a new Microsoft sentinel Workspace called light-monitoring
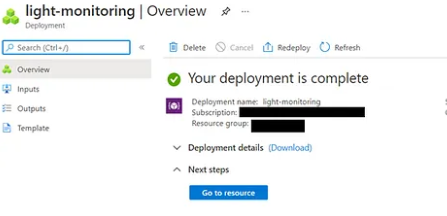
We can mention that we have no logs
At this point, we need to link our Windows 10 machine to our sentinel.
To connect our Win 10 machine, we go to ‘Overview’ and click on ‘Azure Virtual Machine (VMs)’:

We look for our victim machine and we click on “connect”, we are so lucky that our machine is on Azure so the process is much easier else we need to go to “Agent Management” under settings, and download the MMA Wizard or link the machine to sentinel via PowerShell.
Here’s the complete script to link an Azure VM to Sentinel:
# Login to Azure
Connect-AzAccount

# Define variables
$resourceGroupName = "YourResourceGroupName"
$workspaceName = "YourWorkspaceName"
$workspaceLocation = "YourWorkspaceLocation"  # Example: "EastUS"
$vmName = "YourVMName"
$vmResourceGroup = "YourVMResourceGroup"

# Create Log Analytics workspace
$workspace = New-AzOperationalInsightsWorkspace -ResourceGroupName $resourceGroupName `
                                                -Name $workspaceName `
                                                -Location $workspaceLocation `
                                                -Sku Standard

# Get workspace details
$workspaceId = $workspace.CustomerId
$workspaceKey = (Get-AzOperationalInsightsWorkspaceSharedKeys -ResourceGroupName $resourceGroupName -Name $workspaceName).PrimarySharedKey

# Install Log Analytics agent on VM
Set-AzVMExtension -ResourceGroupName $vmResourceGroup `
                  -VMName $vmName `
                  -Name "OMSExtension" `
                  -Publisher "Microsoft.EnterpriseCloud.Monitoring" `
                  -ExtensionType "OmsAgentForLinux" `
                  -TypeHandlerVersion "1.12" `
                  -Settings @{ "workspaceId" = $workspaceId } `
                  -ProtectedSettings @{ "workspaceKey" = $workspaceKey }

# Enable Azure Sentinel
$sentinelResourceId = (Get-AzOperationalInsightsWorkspace -ResourceGroupName $resourceGroupName -Name $workspaceName).Id

Set-AzResource -ResourceId "$sentinelResourceId/providers/Microsoft.SecurityInsights/onboardingStates/default" `
               -ApiVersion "2020-01-01" `
               -Properties @{}
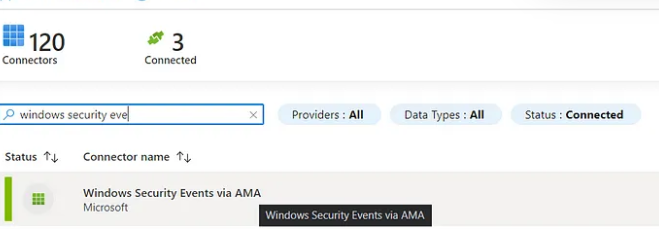
We also installed our connector, via the data connector panel on Sentinel we added the “Windows security events via AMA” connector.
It will take some time; in the meantime, we go to our machine and install Sysmon.
Sysmon installation on Windows 10
To install Sysmon we will follow the steps:
1- Download Sysmon from here: Download Sysmon
2- Run the following command as Administrator:
.\Sysmon64.exe -accepteula -i sysmonconfig-export.xml
You can use .xml as a configuration file on this link: https://github.com/ion-storm/sysmon-config
To update the existing configuration we run the following command:
.\Sysmon64.exe -c sysmonconfig-export.xml
Events now can be viewed with “Event Viewer”. Go to “Applications and Services Logs” -> “Microsoft” -> “Windows” -> “Sysmon”
Installed and works perfectly
Retrieve logs
In Azure Agent management under settings, we can mention that we have one Windows machine connected which is ours, we go and click on “Go to logs”:

And here we are redirected to log management windows, that use KQL as a language to retrieve and filter logs, for more information about KQL check this link: https://docs.microsoft.com/en-us/sharepoint/dev/general-development/keyword-query-language-kql-syntax-reference
From here we can mention that our machine is well connected and we can retrieve the Heartbeat of our machine.
Heartbeat
| where OSType == "Windows"
| summarize arg_max(TimeGenerated, *) by SourceComputerId
| sort by Computer
| render table
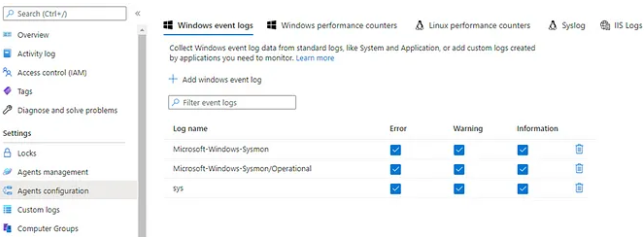
To retrieve Sysmon logs, first, we need to select the logs that we would like to see in “Agent Configuration” under settings as follows:
Adding those event logs, we are able now to retrieve system logs, and Sysmon logs:
- Microsoft-Windows-Sysmon
- Sys
We can retrieve specific logs under Sysmon like only Operational as follows in the next example:
Microsoft-Windows-Sysmon/Operational
From this step, we can go back to Logs and run a command that retrieves all the Sysmon logs:
Detect and Alert on Sentinel
Detect Brute Forcing Attack using KQL
To create an alert, we need to first know what we want to detect and how to detect it so we will begin by simple definitions.
To detect the attack, we need to understand what log we should work on, we need to collect logs of failed successive logins.
KQL code
Based on our understanding we will focus on a successive failed login which is represented by the EventID 4625 in windows, please check this link for more details:
SecurityEvent
| where EventID == 4625
// 0xC0000064 =       User logon with misspelled or bad user account
// 0xC000006A =       User logon with misspelled or bad password
| where (SubStatus == "0xc000006A" or SubStatus == "0xc0000064")
| project TimeGenerated, EventID, WorkstationName, Computer, Account, LogonTypeName, LogonType, LogonProcessName, SubStatus, Activity
Using this code in logs analytics in Sentinel, we may mention that we were a victim to someone trying to brute force our server on RDP.
By checking the IP reputation on the Threat Intelligence platform, we see that the IP is already blacklisted:
Now we can detect the attack we need to create our alert.
Alert Brute Forcing Attack on RDP
To create the alert, we need to go to the Analytics panel and schedule a query rule:
In the configuration panel, we will set a name and a description for our alert:
For the tactics used I picked credential Access based on the MITRE ATT&CK Techniques
We move on to the next panel and we set our query, we will be running the query for the last 5 hours.
SecurityEvent
| where EventID == 4625
| where TimeGenerated > ago(5h)
| project TimeGenerated, EventID, WorkstationName, Computer, Account, LogonTypeName, IpAddress
| extend AccountEntity = Account
| extend IPEntity = IpAddress
To make the alert useful we need to map the important data fields which are:
Affected machine (Host) IP Account being attacked
We will schedule the query to run each 5 hours, and send an alert when the number of results is greater than 5.
No need to trigger an alert for each event, so we will group them all in one alert.
The alert is validated and we finish by creating the alert.
Domain Trust Discovery T1482
- As per MiTRE definition:
-
Adversaries may attempt to gather information on domain trust relationships that may be used to identify lateral movement opportunities in Windows multi-domain/forest environments. Domain trusts provide a mechanism for a domain to allow access to resources based on the authentication procedures of another domain. Domain trusts allow the users of the trusted domain to access resources in the trusting domain.
As explained this technique is used by attackers to have visibility on the potential lateral movements, and possibly the available trusted domains that can be accessed directly.
Why it is important to track Domain Trust Discovery
We need to remember that this technique is only for discovering the potential lateral movements, but we are not sure yet that the attacker already moved to another machine.
Detecting this discovery will give us a hint on the next move of the attacker.
Domain discovery is also part of other tools for hacking:
- Empire and PowerSploit use the DsEnumerateDomainTrusts API calls, LDAP queries for (objectClass=trustedDomain) when enumerating domain trusts, and the .NET method Forest.GetAllTrustRelationships() when enumerating forest trusts.
- PoshC2 uses Forest.GetAllTrustRelationships() from the System.DirectoryServices assembly as well.
Windows — Discover domain trusts with nltest
One of the command that Windows provide for domain discovery is nltest, this command needs to be installed.
Nltest is a command-line tool that is built into Windows Server 2008 and Windows Server 2008 R2. It is available if you have the AD DS or the AD LDS server role installed.
For detection I used this simple query
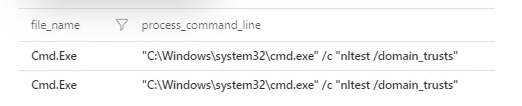
Sysmon_Event_Parser
| extend process = case(process_command_line contains "nltest /domain_trusts", process_command_line,"")
| where isnotempty(process)
My output:
Powershell enumerate domains and forests
This is one of PowerShell commands that may be used for this technique.
For detecting this technique you may try to detect the installation of this packet “cmdlets” for AD admin.
Sysmon_Event_Parser
| extend process = case(process_command_line contains 'Import-Module "$env:TEMP\\PowerView.ps1"', process_command_line,
process_command_line contains "Get-NetDomainTrust", process_command_line,
process_command_line contains "Get-NetForestTrust", process_command_line,
process_command_line contains "Get-ADDomain", process_command_line,
process_command_line contains "Get-ADGroupMember Administrators -Recursive", process_command_line, "")
| where isnotempty(process)
Get-DomainTrust with PowerView
This will allow you to find the trusted domains within the AD, this is useful as you may find another AD that you can access.
You can check the technique on this Link, a long code was used you can check it here
I did not put a lot of effort into the detection but you can find the output below, for this technique you need to read the code and the solution that I am applying in my environment is to make sure that no script are running on PowerShell and to block any downloads from internet in our production environment.
TruffleSnout — Listing AD Infrastructure
On of the tools that are used for enumeration for low noise, one of my preferred tools for Purple teaming, check their repo here.
I believe the question here is not how to detect it, but mainly how the heck do I have a ‘.exe’ running on PS 😊, what do you think?
Conclusion
In this article, we learned how we can set Sentinel and collect logs from one of our machines on Azure, you can check this article on how to install Sysmon on Windows and how to create a parser on Sentinel using KQL.
In the next articles, we will talk more about more features on Sentinel, stay connected ;)